
As crypto traders brace for todayŌĆÖs Bitcoin halving, data shows buy and hold remains the most profitable strategy.
With the Bitcoin (BTC) halving happening in less than four hours, there is strong evidence that investors are continuing to accumulate Bitcoin.&
Readers will recall that on March 12, a day now referred to as Black Thursday, the price of the top-ranked crypto asset on CoinMarketCap crashed more than 50%, registering its second biggest daily drop in history.
While this was an incredibly painful 48 hours for over-leveraged traders, the resulting bargain-bin prices on Bitcoin and other cryptocurrencies presented a potential once-in-a-lifetime opportunity for long-term investors.
BitcoinŌĆÖs impressive rise from $3,750 to $9,450 aside, just how much of an opportunity these past few weeks have been is also clear to see in a number of on-chain and market cycle sources.
On-chain data provides unique insight into the behaviour of market participants by analyzing transactions that take place on the blockchain. From the size of transactions and wallets& to more complex tools, blockchains offer a wealth of data.&
The information drawn from blockchains can help investors and researchers understand what has happened to price in the past, and it can also offer guidance on what to expect in the future.
Bitcoin price briefly dropped below its cost basis
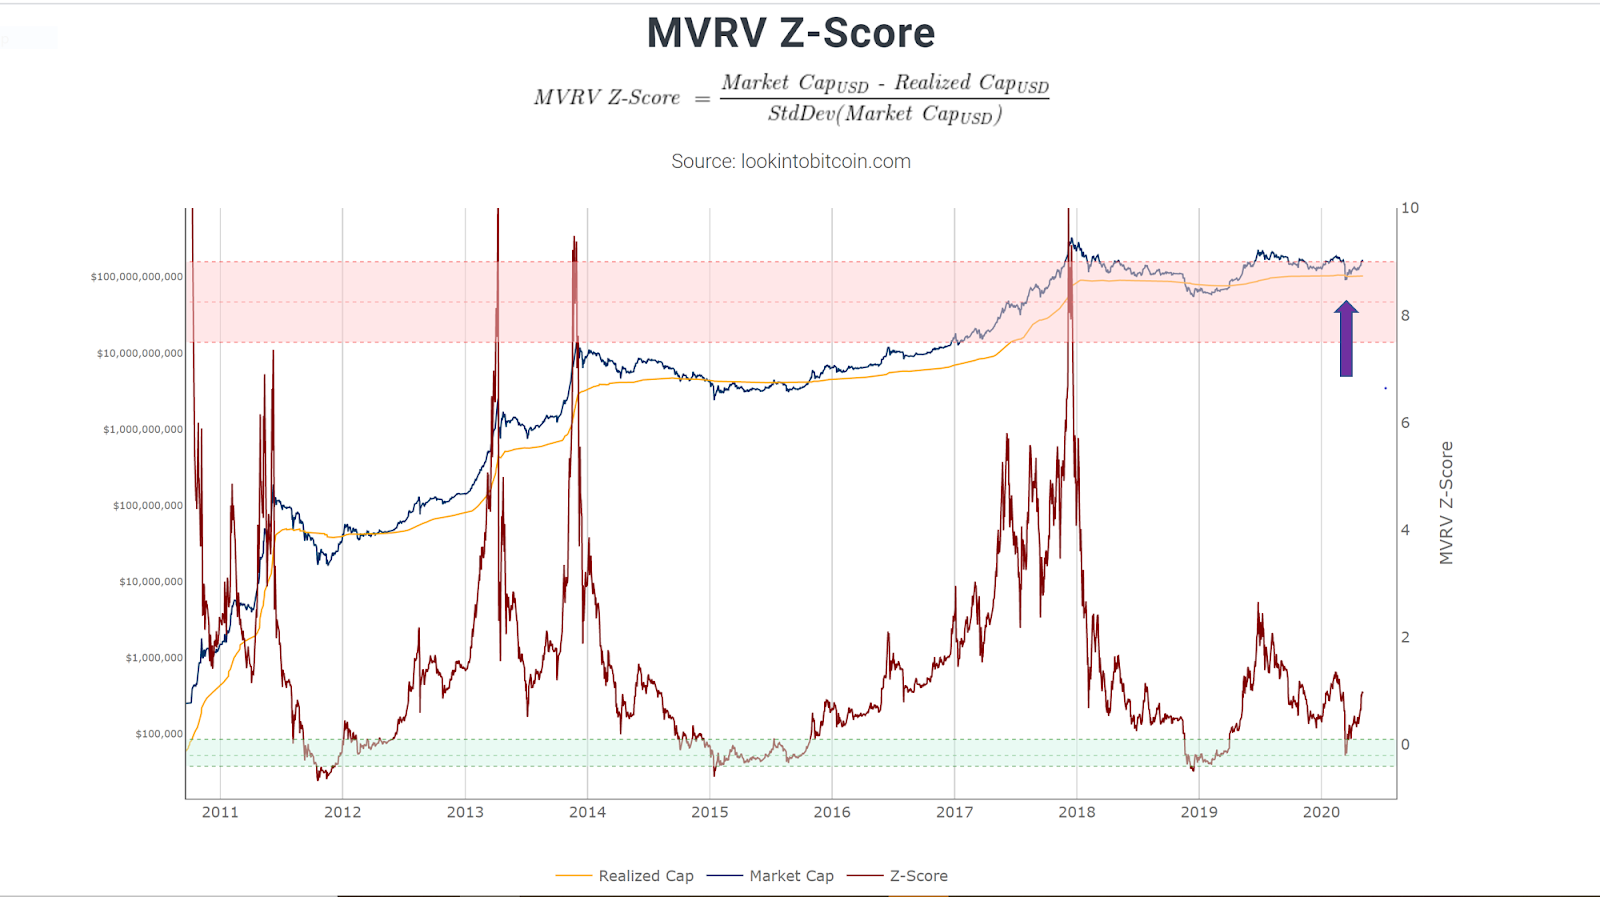
Bitcoin MVRV Z-Score. Source: lookintobitcoin.com
The MVRV Z-score is an on-chain indicator that uses blockchain analysis to identify periods where Bitcoin is extremely over- or undervalued relative to its "fair value." The "MV" part of the name stands for "market value," which is essentially the market capitalization of Bitcoin, or the number of coins in circulation multiplied by price.& &
The "RV" part stands for "realized value," which uses the price of coins when they were last sent from one wallet to another& rather than the current price. So, we can think of realized value as the average cost basis investors paid for their Bitcoin.
In the week following Black Thursday, market value (the blue line on the chart above) was lower than realized value (the orange line). This moment is highlighted by the arrow on the chart. This is a rare occurrence in BitcoinŌĆÖs history due to the digital currencyŌĆÖs aggressive price growth over time, and whenever this occurs it signals an incredible buying opportunity for long-term investors.& &
In addition to this, the indicator also uses a standard deviation line called the Z-score (the red line on the chart) that pulls apart differences in the MVRV data. The Z-score can call market bottoms (the green zone) and tops (the red zone) very effectively.& &
It has called the previous market cycle tops to within two weeks! After a brief dip into the green "buy" zone, the Z-score has now excited and has been rising rapidly since, resulting in the recent price spike up beyond $10,000.
Whales buy the dip following a simple indicator
The 200-week moving average has been a consistently resolute support for Bitcoin over time. As shown below, when the price retraces back to this moving average it has historically been a great "buy-the-dip"& opportunity.& &
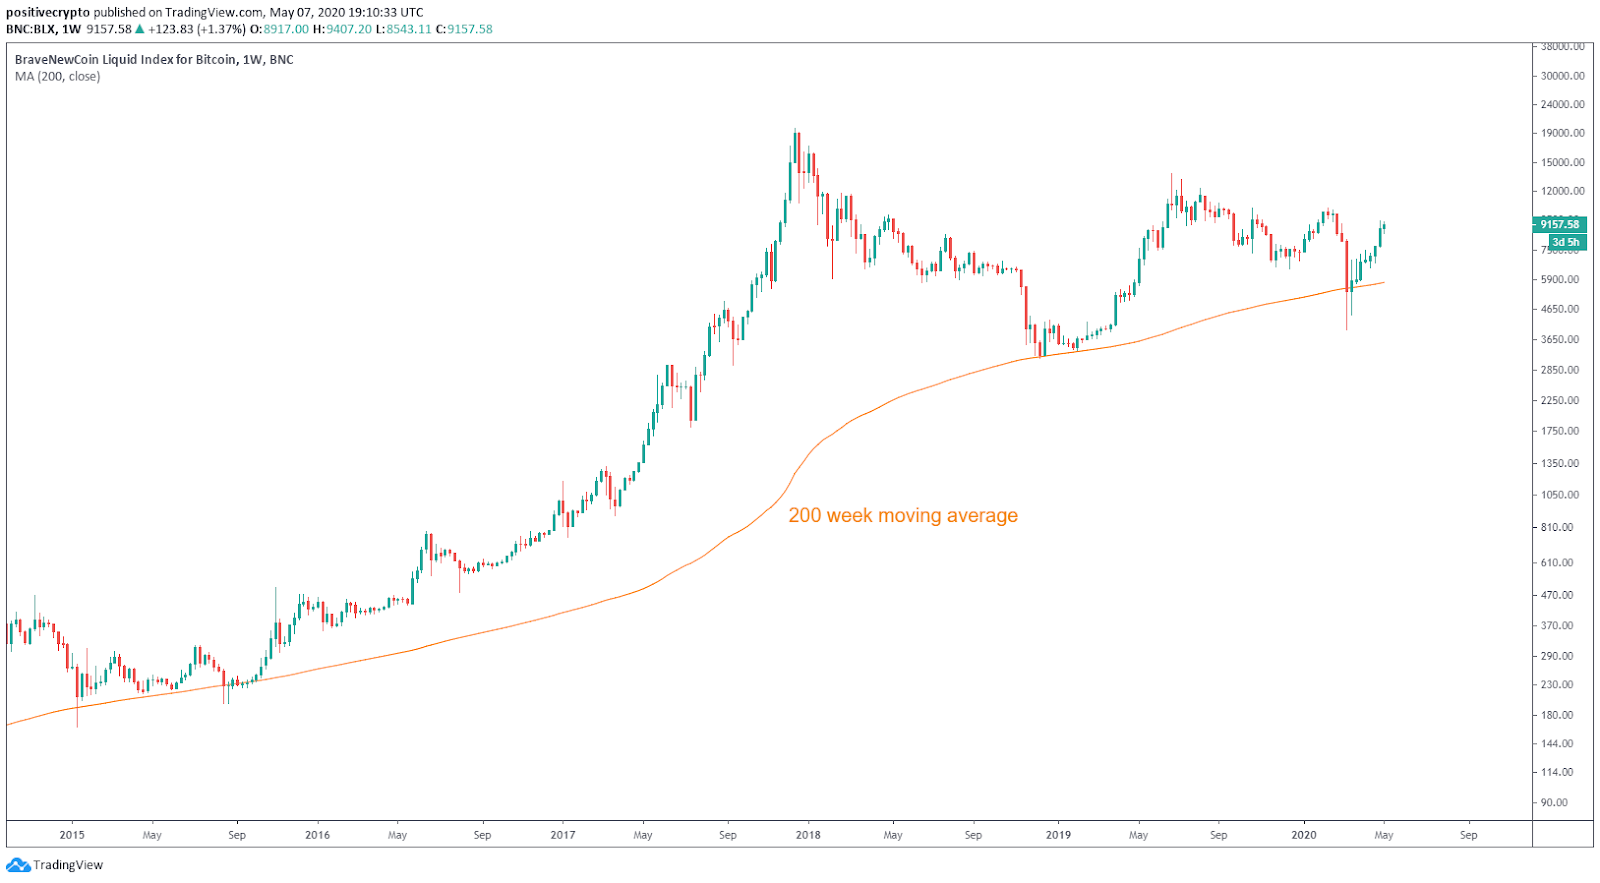
BTC&-USD one-week chart. Source: TradingView
Whales are known to seize on the opportunity and start buying whenever price hits this key level. CryptoCobain, a Bitcoin OG and whale, was not shy about his buying at these levels during the recent market crash. The Bitcoin whale humorously tweeted:&
I call upon the old gods. I call upon the new gods. I summon you. In the words of the elders, pump it
In addition to just using the standard 200 (WMA) line, it is possible to create a heatmap from its movement over time, given its role as a key support for Bitcoin price.&
The 200-WMA heatmap chart shows that while Bitcoin price has bounced hard from this important moving average over the past few weeks, there is still a long way to go before the market becomes overheated.&
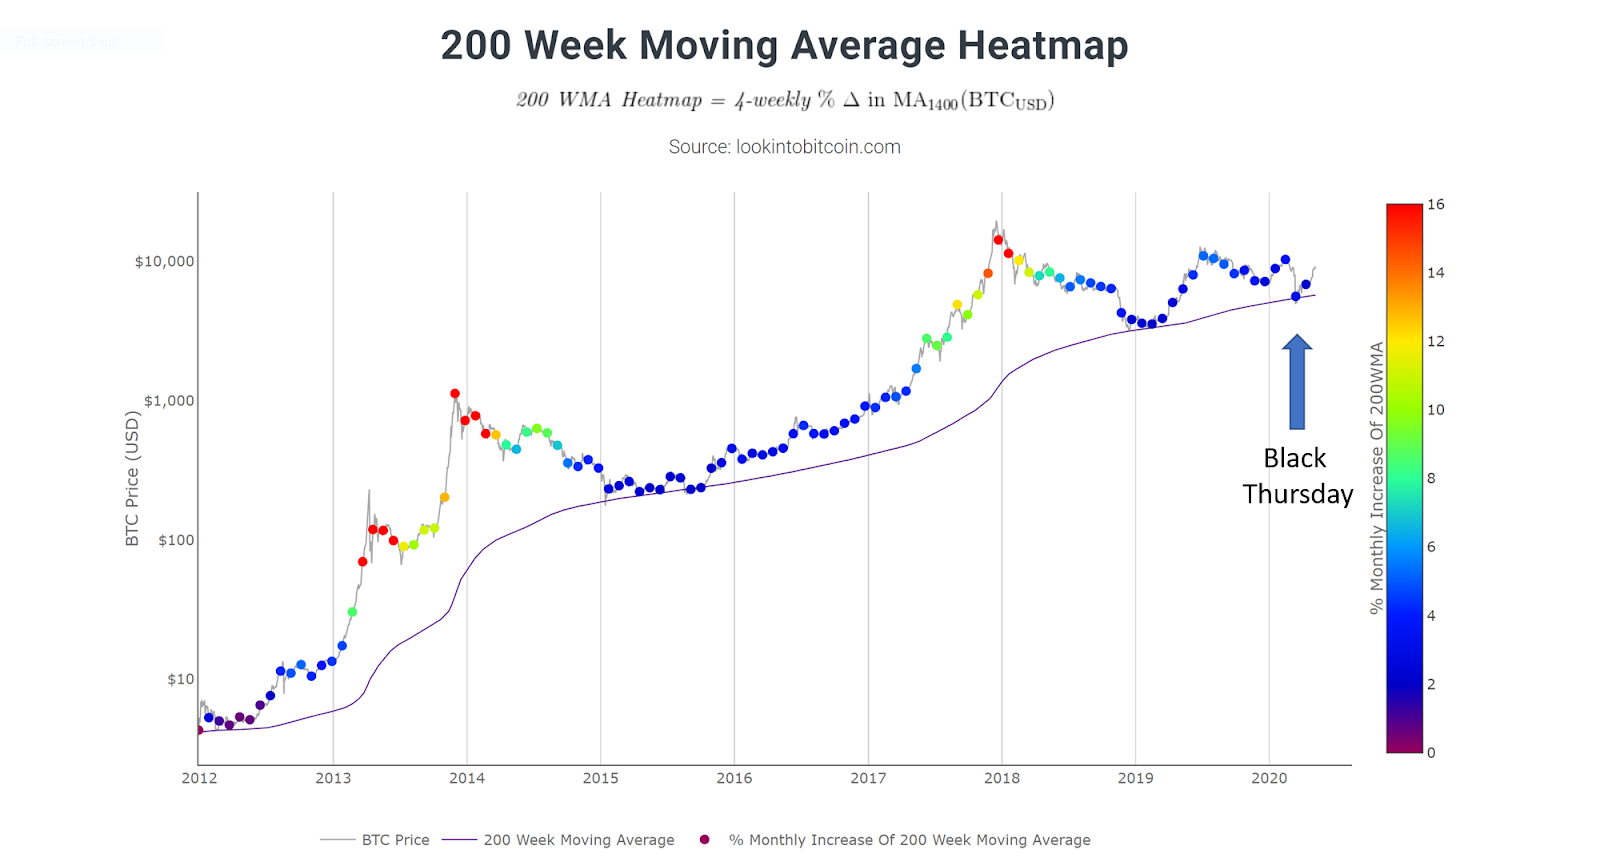
200-Week Moving Average Heatmap. Source: lookintobitcoin.com
The orange and red dots on the Bitcoin price line represent high monthly changes of between +12 and +16% to the 200WMA. Historically these colours have highlighted the months where Bitcoin's price is becoming overextended and where the market begins to top out.& &
Currently, the price remains firmly in the dark blue, so one could interpret this as meaning that price has plenty of room to increase based on BitcoinŌĆÖs previous market structures.
Long-term investors continue to HODL
On-chain data continues to show that sentiment among mid- to long-term investors remains positive and that they are not prepared to sell their holdings any time soon.
Despite the major volatility in Bitcoin's price in recent months, the percentage of Bitcoin that has not moved on-chain for over a year has remained around 60%. This indicates there are strong hands among Bitcoin investors.& &
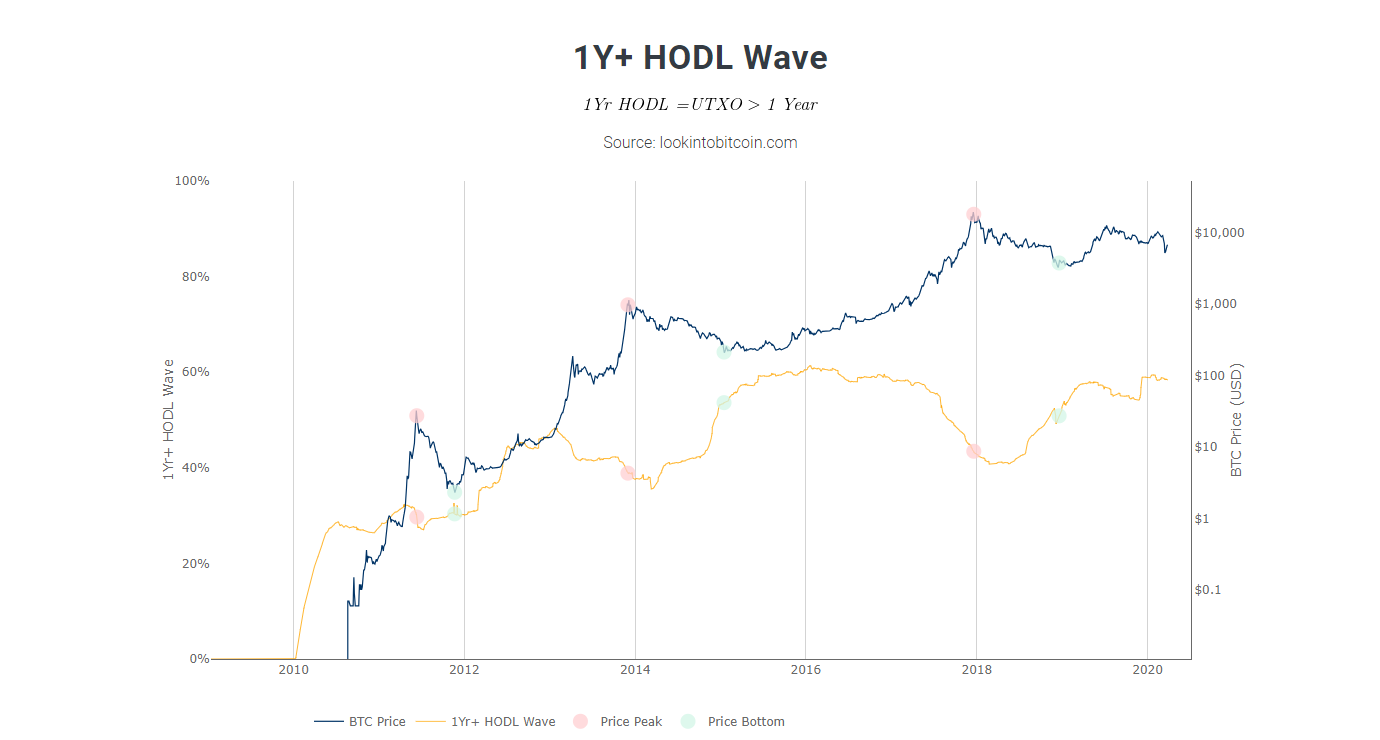
1 Year+ HODL Wave. Source: lookintobitcoin.com
The chart also shows the cyclical nature of HODLŌĆÖing. There is typically a sustained drop in the number of coins held for over a year as the market approaches the late stages of a Bitcoin bull market.&
This is shown by the green down arrows on the chart below. Currently, there is no sustained drop in +1yr HODLŌĆÖing, which again suggests the market is just starting to enter a new bull market with investors accumulating more Bitcoin.
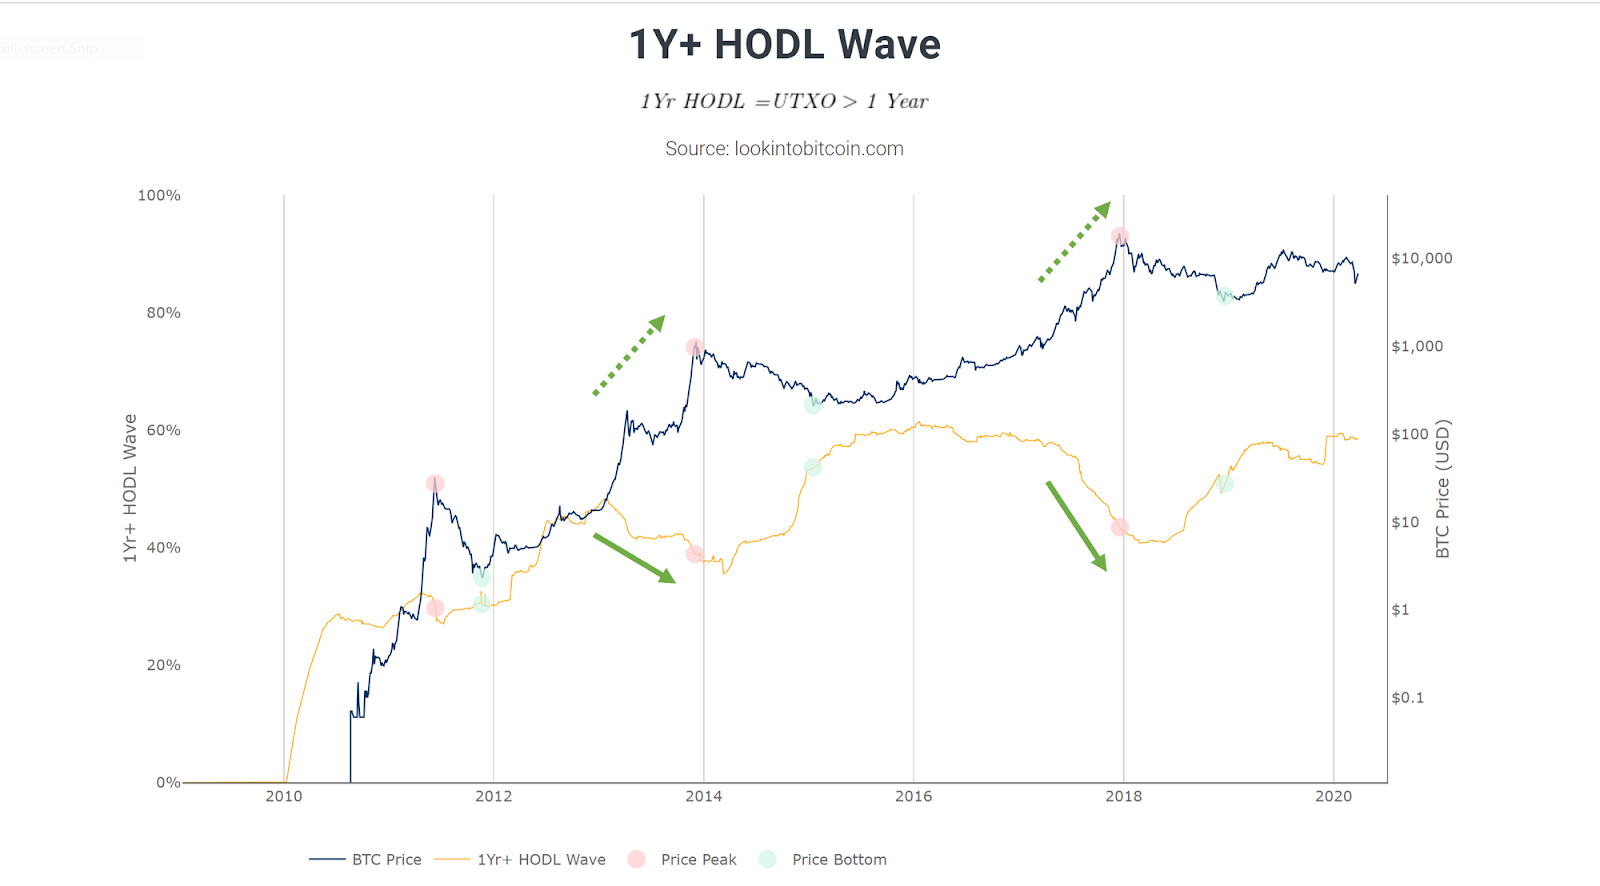
1 Year+ HODL Wave. Source: lookintobitcoin.com
As the wider market becomes more aware of these levels of HODLŌĆÖing, this will put further demand-side pressure on an already scarce asset.
Recent weeks show rapid changes in investor sentiment
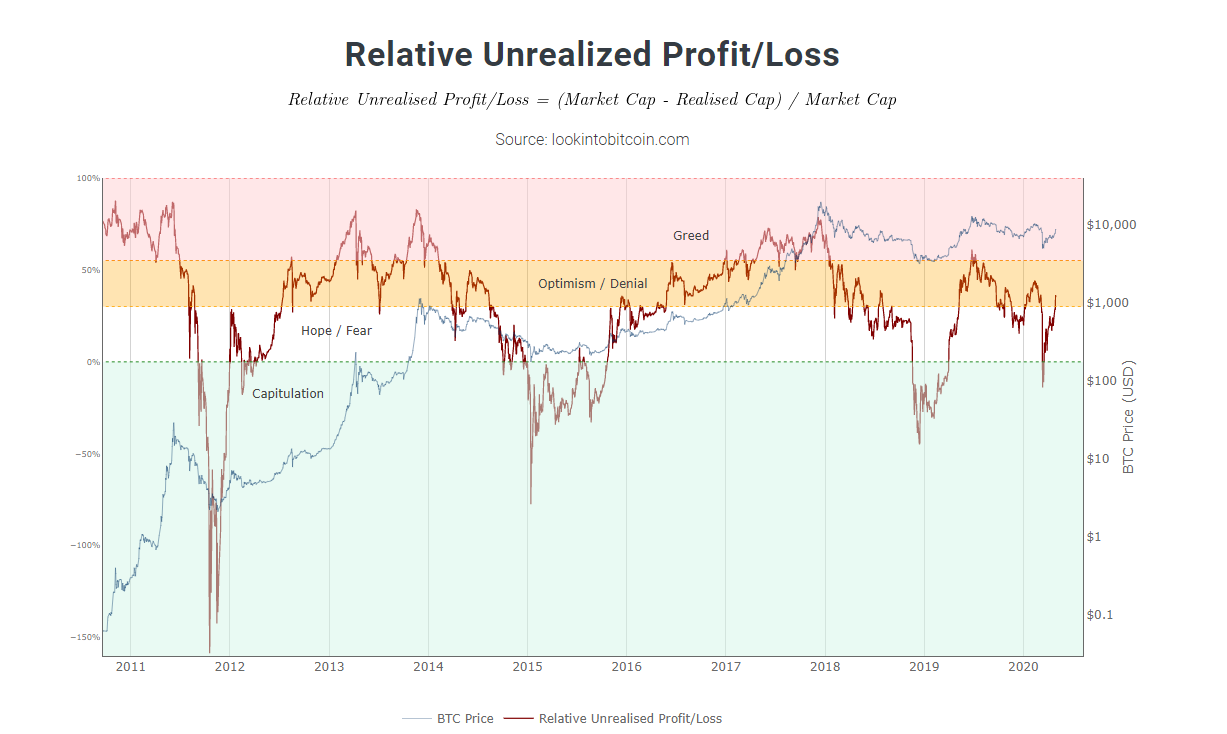
Relative Unrealized Profit/Loss. Source: lookintobitcoin.com
After briefly dipping into the capitulation level six weeks ago, the market spent the past few weeks in the hope and fear area. The most recent pump shows investor sentiment entering the optimism and denial stage.
The Relative Unrealized Profit/Loss metric is able to monitor market sentiment through actual market activity, rather than just claimed behaviour. It is able to achieve this by looking at the ratio between Bitcoin's market cap and when investors are taking profit.& &
In doing so, it has consistently highlighted the key market stages throughout BitcoinŌĆÖs history, including market tops and bottoms.&
In fact, looking back at previous cycles we can see that it is likely to be some time before investor sentiment reaches the greed level which has historically proven to be an excellent time to take profit for the smart investors.
BTC days in profit continues to rise
While Bitcoin volatility over recent months has had some traders feeling queasy, zooming out to view the long term shows long-term HODLŌĆÖers continue to benefit from the assetŌĆÖs remarkable ascent over time.
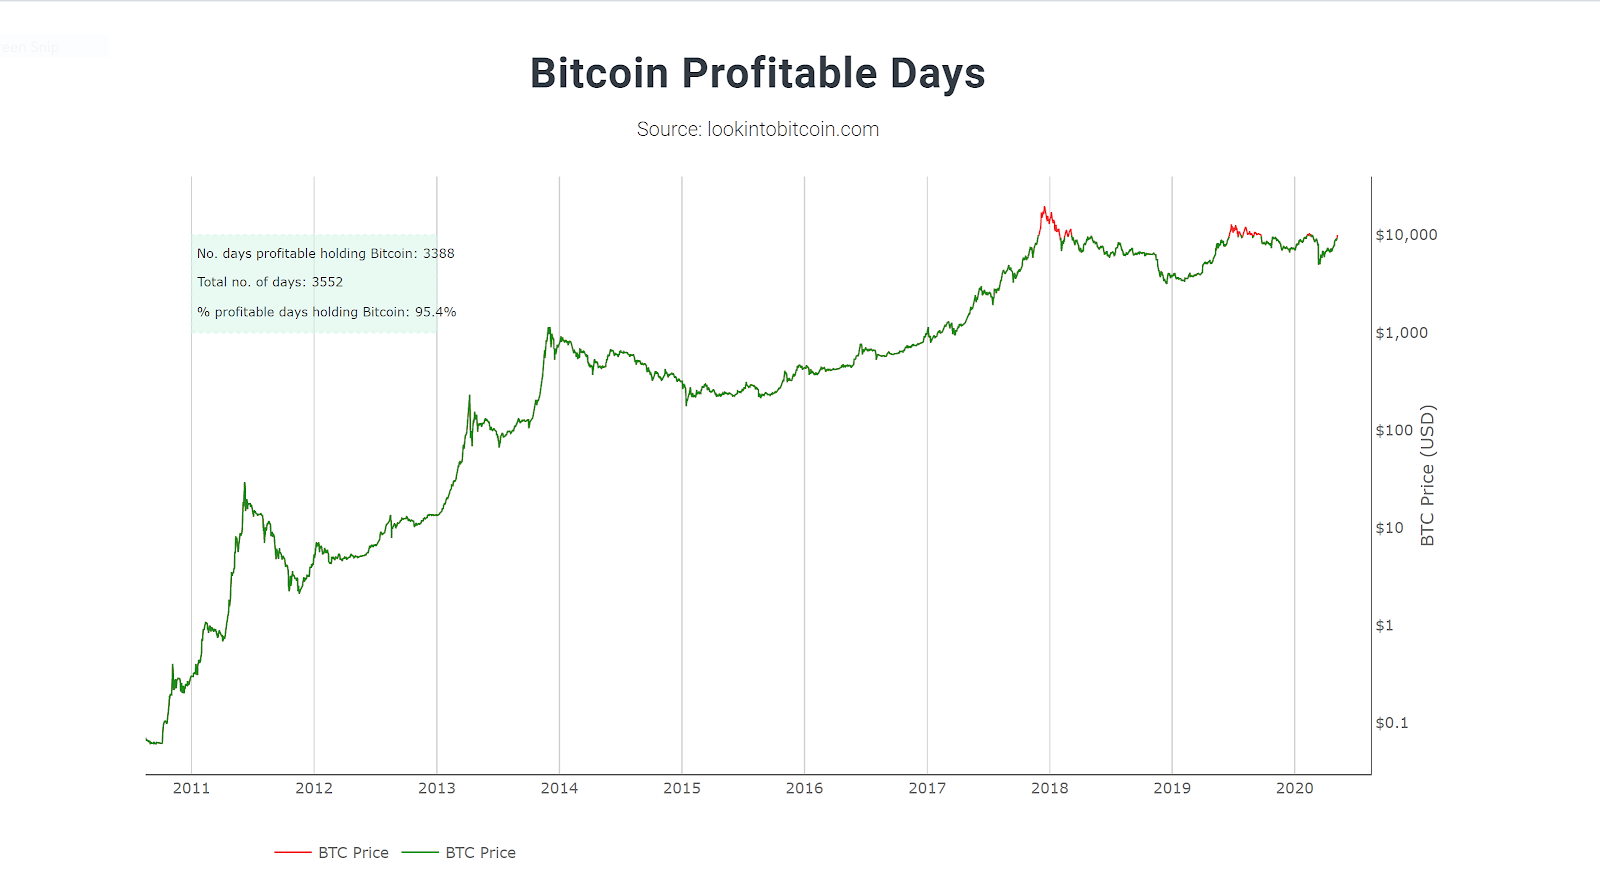
Bitcoin Profitable Days. Source: lookintobitcoin.com
Reviewing the percentage of days in BitcoinŌĆÖs history where buying Bitcoin would have put investors in profit at todayŌĆÖs prices, we see it stands at a staggering 95.4%.& For those who can stomach the short term price swings, patience clearly pays.& &
As the halving draws ever closer and central banks across the globe continue to print without pause, any of the significant downside risks associated with Bitcoin are beginning to look increasingly limited.
Thus, the only thing left for investors to wonder about is: How soon will it be before the percentage of profitable days for holding Bitcoin reaches 100% as the price breaks out into new all-time highs?
The views and opinions expressed here are solely those of the author and do not necessarily reflect the views of Cointelegraph. Every investment and trading move involves risk. You should conduct your own research when making a decision.

Comments